Piktochart

Description
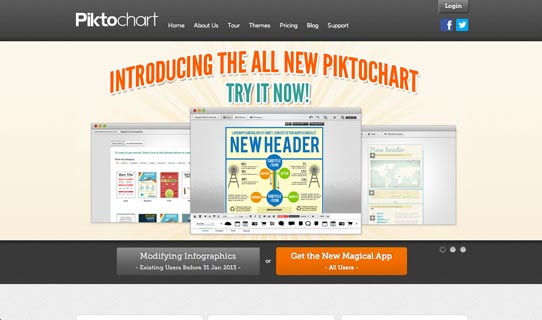
Your first step to create infographics begins here.
Everything works via a drag and drop. In our latest version, we added in some design tools that you cannot live without , e.g. hex color changes, opacity controls, rotate, grouping, multi-select, duplicate an entire section and an overall greater flexibility to modify an infographic. That means you can get an infographic done in an even shorter time span!
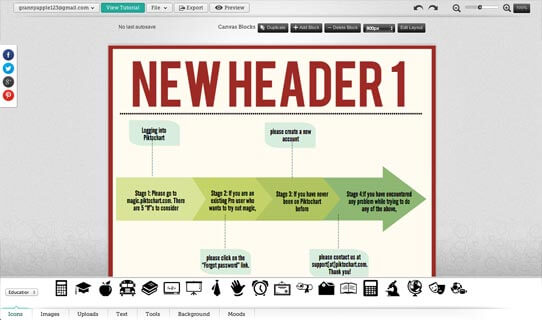
The Pro version has over 10 ways of visualizing data from the most basic dot, line, bar charts to more complicated types gauge, donut charts etc. When saving in HTML, you will also see a nice hover effect to display the numbers over the chart.
You can now access icons and images from our library of graphics. Pro users will access a gigantic library of more than 1,000 graphics. We also added SVGs which makes it easier for you to export higher resolution infographics. Piktochart is all set to help you get print-quality infographics.
Pricing
| Plan | Price | Details |
|---|---|---|
| Free | Free | 6 basic themes, basic customization, 10 slots for image upload only, Piktochart's watermark. |
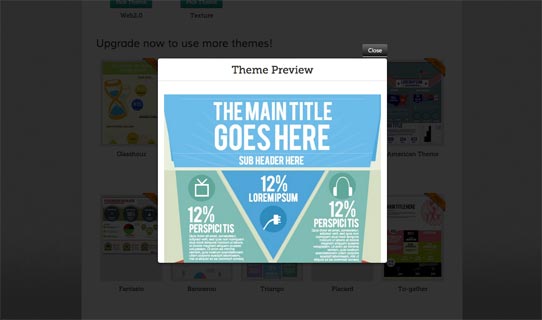
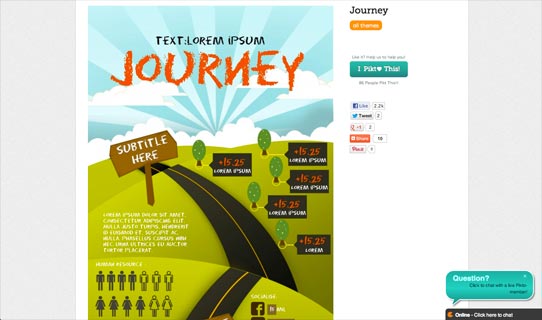
| Education | $39.99/month | Over 100 professional themes and growing, better customization, more image uploads, no Piktochart's watermark. |
| Education Bulk Subscriptions | $3/month per student | We also offer schools bulk subscription starting from $3/month/student (for a minimum of 20 students/4 months), please contact us for more details. |
| Monthly Pro | $29/month | Over 100 professional themes and growing, over 1,000 images/icons in the library, embed HTML code on your own website and download high resolution images, better customization, more image uploads, no Piktochart's watermark. |
| Annual Pro | $169/month | Less than half of the monthly price! Over 100 professional themes and growing, over 1,000 images/icons in the library, embed HTML code on your own website and download high resolution images, better customization, more image uploads, no Piktochart's watermark. |
An easy to learn tool for creating infographics (visuals) of anything. Create charts, insert pictures, data, etc.
I used it to create our agenda for PD. I wanted to model everything we were using. Quick to learn for students and adult learners.