EarthViewer
Description
What did Earth’s continents and oceans look like 250 million years ago, or even 1 billion years ago? What do we know about the climate back when our planet formed?
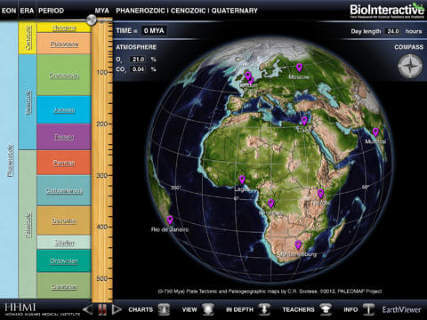
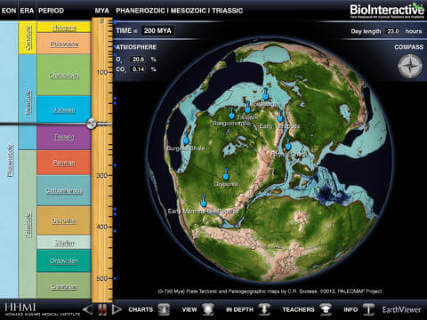
EarthViewer is like a time machine for exploring Earth’s deep history. Based on the latest scientific research, it lets you scroll through the last 4.5 billion years with your fingertips. Follow a favorite landmark, be it Greenland or New York City, as its position shifts through time, or watch a famous fossil like Tiktaalik make an incredible journey from its origin to its current location. Layer your view of shifting continents with data on atmospheric composition, temperature, biodiversity, day length, and solar luminosity, to get a more complete view of our dynamic planet.
EarthViewer features include:
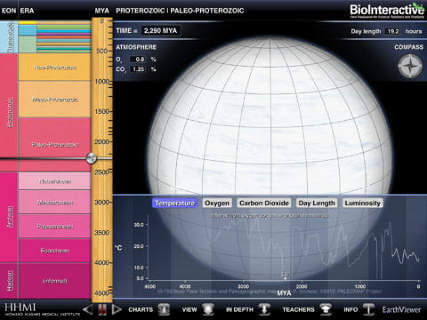
• Continental reconstructions and accompanying data dating back billions of years
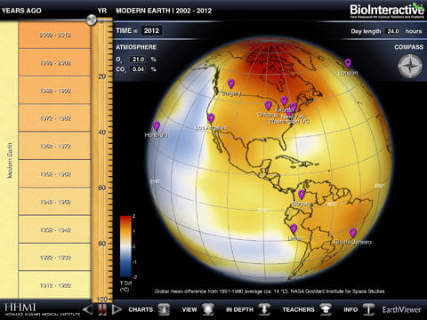
• World temperature map for the last 100 years
• Ability to manipulate the globe and zoom to any location
• Locations of modern cities tracked back over 500 million years
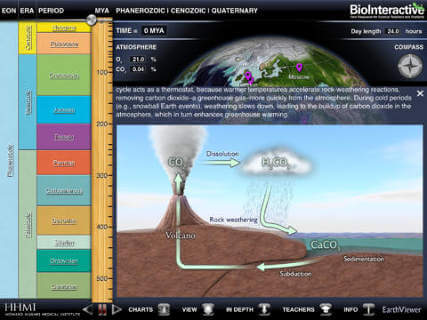
• In-depth features on major geological and biological events in Earth history
• Clickable details on geologic eons, eras, and periods
• Automated play modes
• Extensive reference list
• Suggestions for classroom use
• Tutorial videos
The Howard Hughes Medical Institute (HHMI) is a non-profit medical research organization that ranks as one of the nation’s largest philanthropies. HHMI’s BioInteractive initiative opens a window on cutting-edge science through interactive web features, short films, virtual labs, and scientific animations. Since teachers play a pivotal role in launching the careers of future scientists and in helping the public understand the beauty and import of science, the BioInteractive team partners with the teaching community to create and distribute media that is engaging and relevant to the science curriculum.
Pricing
| Plan | Price | Details |
|---|---|---|
| EarthViewer | Free | Compatible with iOS devices. |
I use this app to illustrate changes in the earth over time. I also use it to explore climate data and mass extinction events. It includes graphs to compare data.